Archive for the ‘BYND’ Category
Posted by pugsma on October 26, 2020
What is the PUG Stock Market Analysis (SMA) Custom Chart Technical Analysis (TA) Service?
Link: https://pugsma.com/custom-chart-ta-service/
- A customer requests an initial technical analysis chart on a stock, index or commodity. Click Link to Buy: Price $60
- Customer can request the time frame (15-min, 60-min, 4-hr, daily) used for the chart.
- Technical Analysis could be Elliott Wave based and/or chart pattern recognition.
- BEFORE Paying, Send an e-mail to PUG (Steve) at pug.sma.llc@gmail.com with chart initial request details.
- Allow up to 2 business to complete the initial chart technical analysis work.
- A customer requests an update to the chart. Click Link to Buy: Price $30
- Price is for each update requested after the initial chart.
- BEFORE Paying, Send an e-mail to PUG (Steve) at pug.sma.llc@gmail.com with chart update details.
- Allow up to 1 business days to complete the updated technical analysis work.
- Access to the Annual Custom Chart Archive of ALL custom charts prepared for ALL subscribers. Click Link to Buy: Price $240 (access the entire 2021 calendar year).
- Custom chart archive access gives a subscriber access to ALL custom initial and update charts prepared across the calendar year.
- This is not just their own personal charts, but ALL charts prepared for ALL other subscribers (expected to be several 10’s if not 100’s of charts).
- 2020 Charts: REGN 5-8-20, AR 5-8-20, XLE 5-15-20, BMO.TO 5-20-20, FLIR 5-21-20, BYND 6-8-20, SHAK 6-29-20, RDFN 6-29-20, EXAS 7-17-20, AMZN 7-23-20, AAPL 7-24-20, FFIV 7-31-20, TSLA 7-31-20, MSFT 8-4-20, CZR 8-14-20, DKNG 8-14-20, NFLX 8-14-20, GILD 8-27-20, JETS 9-17-20, THCX 10-9-20, ARKK 10-13-20, NOK 10-29-20, DMRC 10–31-20
Posted in AAPL, AMZN, AR, BYND, CZR, DKNG, EXAS, FFIV, FLIR, MSFT, NFLX, Offer, RDFN, REGN, SHAK, TSLA, XLE | Tagged: Chart Pattern, Elliott Wave Technical Analysis | Comments Off on PUG Stock Market Analysis Custom Chart Technical Analysis Service
Posted by pugsma on May 8, 2020
During March, BYND price broke below 71.91 and thus Primary 2 (P2) continued lower dropping to 48.18, but holding above the start of Primary 1 (P1) at 45.00.
Since the P2 low at 48.18, there are clearly 5 waves up to 127.84 for major [1] of Primary 3 (P3). Major [1] could be over at 127.84 or could extend to the 135.23 pivot area (where minor 5 =1.62*minor 1 target at 137.79), before the major [2] pull-back to the 100 area.
BYND 4-hr chart (as of Close 5-7-20):

Posted in BYND | Tagged: Elliott Wave Technical Analysis, Technical Analysis | Comments Off on May 8th, 2020: BYND 4-hr Chart Update
Posted by pugsma on March 4, 2020
As long as BYND holds the 71.91 low (it recently hit 85.00), then it’s constructive for a move much high than the 239.71 high from July 2019.
BYND 4-hr chart:

Posted in BYND | Tagged: Technical Analysis | Comments Off on March 4th, 2020: BYND 4-hr Chart Update
Posted by pugsma on February 12, 2020
Looks like the major [2]-P3 low may be in place 102.43, which is right at the 50% Fibonacci target of 103.57. The major [3]-P3 wave up should lead to new all-time highs above 239.71
BYND 4-hr chart:

Posted in BYND | Tagged: Elliott Wave Technical Analysis, Technical Analysis | Comments Off on February 12th, 2020: BYND Chart Update
Posted by pugsma on January 15, 2020
Back on November 11th, 2019 with BYND trading near $76, I showed a 4-hr chart indicating that there was a bullish falling wedge that was likely bottoming near $70.85. The low was $71.91. Now here we are in mid-day January 2020 and BYND has rallied to $135.23.
BYND 4-hr chart 11-11-19:

BYDN 4-hr chart 1-15-20:
Posted in BYND | Tagged: Elliott Wave Technical Analysis, Technical Analysis | Comments Off on January 15th, 2020: BYND 4-hr Chart Update
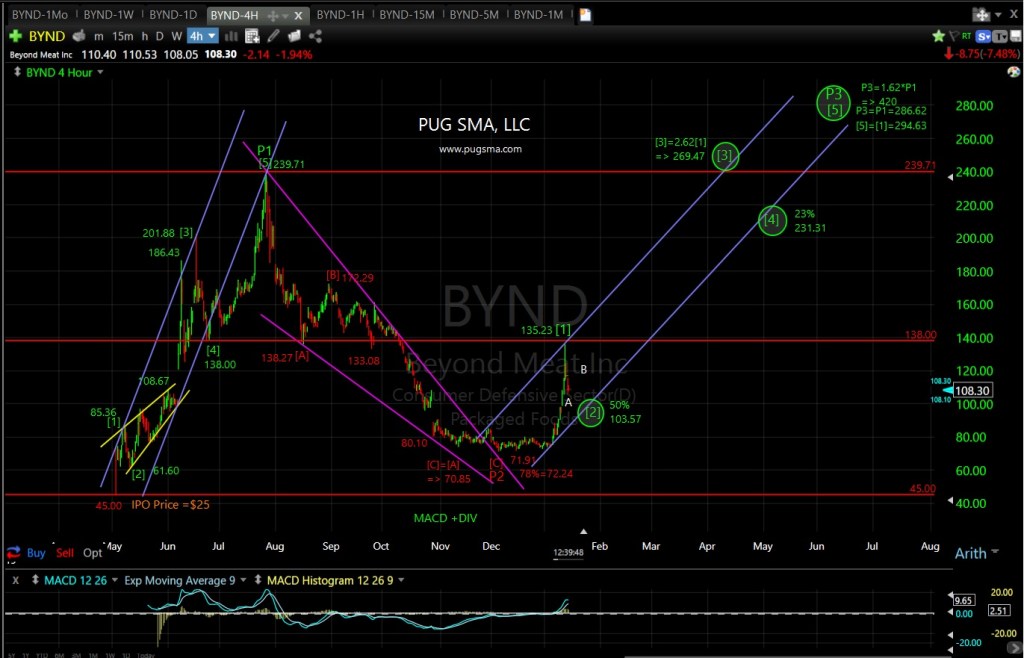
Posted by pugsma on November 12, 2019
BYND price initially made a 5-wave move up from the IPO price of $25 to a high of $239.71; possible Primary 1 (P1) wave.
BYND price next a made 3-wave move down from $239.71 to $73.38; possible Primary 2 (P2) wave, where major [C]=[A]=70.85 and the 78% Fibonacci retracement of 72.24.
Primary 3 (P3) wave target is at 1.62*P1 = $420.
BYND 4-Hour Chart:

Posted in BYND | Comments Off on November 12th, 2019: BYND 4-Hour Chart


You must be logged in to post a comment.