July 27th, 2020: SP-500 Technical Analysis
Posted by pugsma on July 27, 2020
6:10 pm EST: The SP-500 opened flat from 3215, then rose all day to close near the high (3241) at 3239.
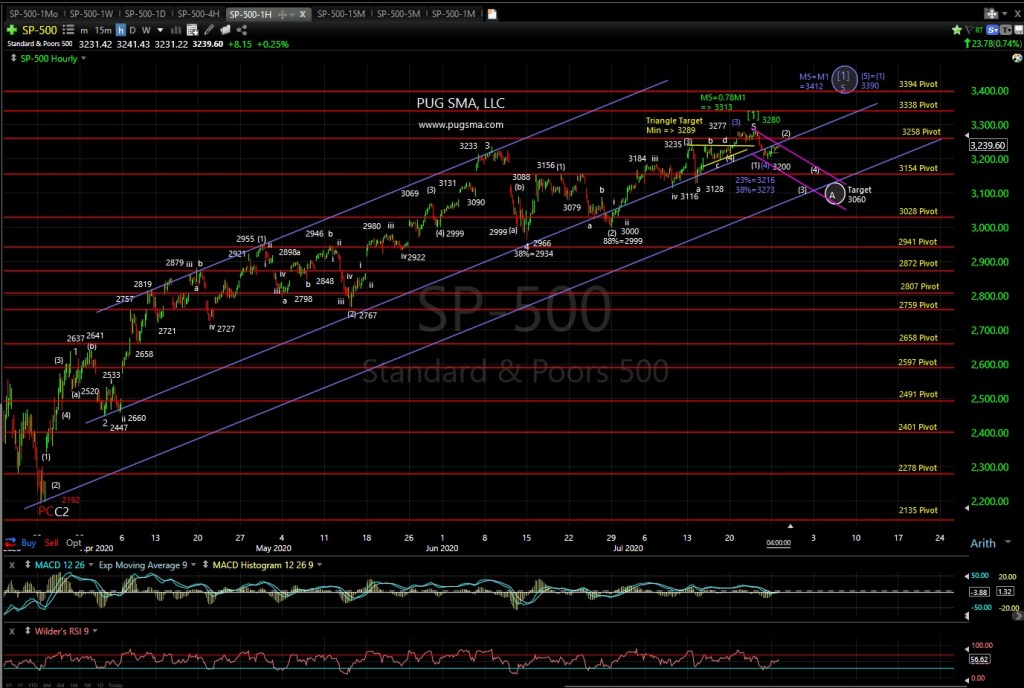
3280 becomes a potential top major [1]-P1-C3 top per the primary (white/green) count. The SP500 price will take a break below 3200 then below 3156 to confirm. The move down from 3280 to 3200 is minute (1) of minor A of major [2]. The rebound from 3200 to 3241 (50% Fib) thus far is a minute (2) wave that must remain below the 3280 high. I have an initial target area for minor A of major [2] at 3059.
The alternate (blue) count is that minute (4) of minor 5 of major [1]-P1-C3 completed at 3200, between the 23%/38% Fibs of 3216/3173. Next should be the final push higher in minute (5) to the minor 5 = minor 1 target of 3412. This alternate (blue) count remains valid above 3200 and then above 3156.
Ideal resolution of the 3200 to 3280 range should determine which wave count is correct.
SP-500 15-min chart:
SP-500 60-min chart:
SP-500 4-hr chart:
Sorry, the comment form is closed at this time.


You must be logged in to post a comment.