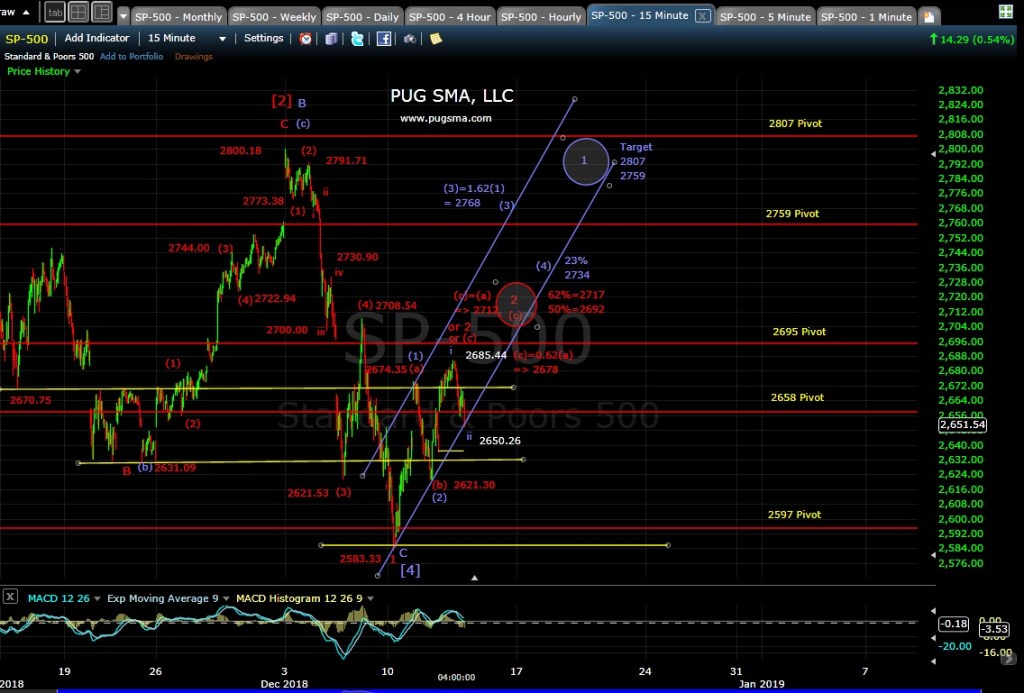
December 12th, 2018: SP-500 Chart Update
Posted by pugsma on December 12, 2018
7:30 pm EST: The bullish blue count is looking for minute (1)-(2), i-ii start to the minor 1 of major [5]-P5-C1 wave. This means the next wave should be a large more up in wave iii-(3). The (3)-1.62(1) target is at 2768 and the minor 1 wave should reach the 2807 pivot area. Ultimately, the major [5]-P5-C1 wave will break above the 2941 high.
For the bearish red count the minor 2 of major [3]-PA-C2 may have topped today at 2685, where (c)=0.62(a) and just below the 50% Fib retrace of 2692. That next wave would be very bearish minor 3 of major [3] wave that will bust below the 2583 low and head for 2300. Ultimately, the PA-C2 wave will reach the 2100 area.
Right now the blue count has a edge as there is 2-month long +DIV on the daily MACD and the NYMO.
SP-500 15-min chart real-time link: http://www.freestockcharts.com?emailChartID=875de275-17a6-438a-b546-34fa5aedc825
SP-500 15-min chart:
Sorry, the comment form is closed at this time.


You must be logged in to post a comment.