August 19th, 2020: SP-500 Chart Update
Posted by pugsma on August 19, 2020
6:10 pm EST: The SP-500 opened flat from 3390, crept higher to 3399 (New All-time high), drifted sideways, then sold off to 3370 and closed at 3375,
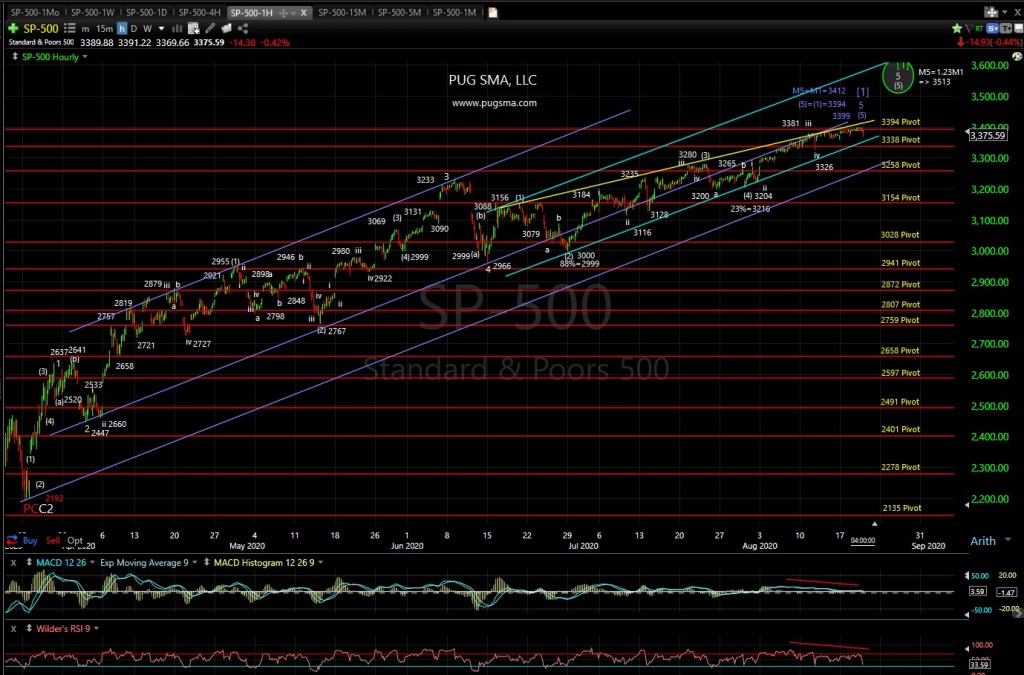
The SP-500 is looking to complete major [1]-P1-C3 in the range of 3411 (blue count) where M5=M1 to 3513 (white/green count) where M5=1.23*M1.
Note: The alternate (blue) count completed a perfect 3-push up, ending diagonal pattern today at 3399 for wave v-(5) of minor 5 of major [1]. This would make a classing major [1] top. There is negative divergence cross the daily RSI, MACD and NYMO and positive divergence on the VIX to support a major top at this point. Breaking below 3326 will confirm the major [1] top at 3399 and major [2] wave down is underway towards the rising 200-day SMA at 3070.
SP-500 15-min chart:
SP-500 60-min chart:
SP-500 4-hr chart:
SP-500 daily chart:
Sorry, the comment form is closed at this time.


You must be logged in to post a comment.