June 30th, 2020: SP-500 Chart Update
Posted by pugsma on June 30, 2020
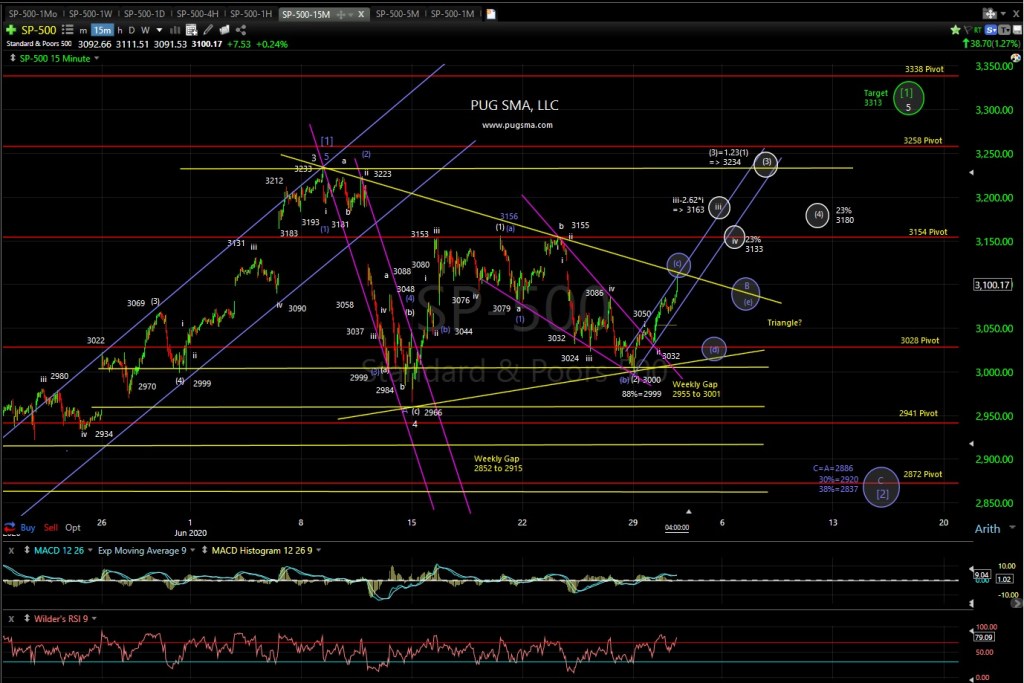
5:00 pm EST: The SP-500 opened flat from 3053, dipped to 3048 (day’s low) and rallied to close at 3100 near the day’s high of 3108.
The primary (white/green) count that minute (2) of minor 5 of major [1]-P1-C3 low is in place at 3000, which was at the 88% Fib of 2999 and the triple top (3156) target of 2996. The minute (3) wave of minor 5 is underway with conservative target of (3)=1.23(1) at 3234. The minor 5 target range is from minor 5 = 0.62, 0.78, or 1.0 * minor 1 at 3242, 3313, or 3412. The primary (green) count is valid above the minute (2) low at 3000.
The alternate (blue) count is that major [2]-P1-C3 has been underway since the early June 3233 high and is looking to complete a single Zig-Zag at the minor C=A target of 2889. The minor B wave looks to be forming a contracting triangle pattern. Once the triangle is complete the minor C wave should drop to the 2872 pivot area to complete major [2]. The alternate (blue) count remains valid below minute (a) of minor B high at 3156.
House Keeping: For Quarterly Premium Service Subscribers, Q2-2020 (Apr-June) ended today. An e-mail was sent out on Monday with payment options for Q3-2020 (July-Sept) or Q3/Q4 (July-Dec).
SP-500 15-min chart:
SP-500 60-min chart:
SP-500 4-hr chart:
SP-500 daily chart:
SP-500 weekly chart:
SP-500 monthly chart:
Sorry, the comment form is closed at this time.


You must be logged in to post a comment.