May 26th, 2020: SP-500 Chart Update
Posted by pugsma on May 26, 2020
11:20 am EST: The SP-500 gapped up from 2956 to 3004 and quickly hit 3022.
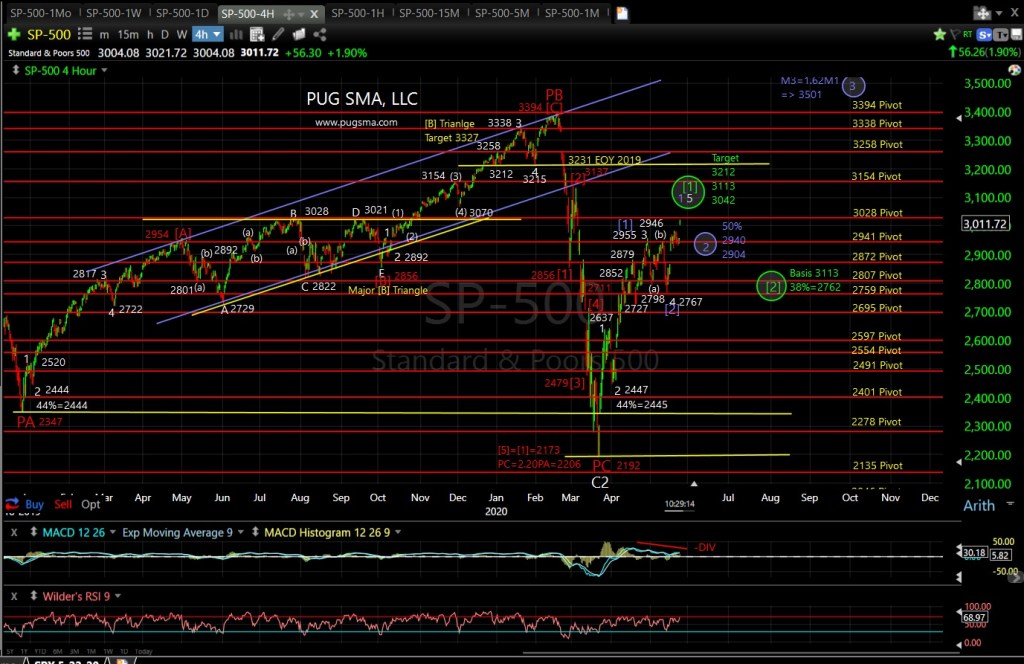
The primary (green) wave count continues to track the minor 5 of major [1]-P1-C3 wave higher towards the targets that range from M5=0.62*M1 at 3042, M5=0.78*M1 at 3113 and M5=M1 at 3212. Breaking above the 200-day SMA (3000) and reaching the 3113 area for major [1]-P1-C3 would follow the year 2009 analog (that I’ve been posting through out May )for major [1]-P1-C1 very well. In year 2009, the major [2] pull-back was only a 30% retrace of major [1], which would be at 2837, basis major [1] ending at 3113. Remember at the 2767 low the week before last, I indicated that this 2767 low is likely the lowest area that will be seen for the rest of the P1-C3 wave headed above 4000.
The new alternate (blue) count is that major [2]-P1-C3 bottomed at 2767. I’ve been hinting at this very bullish wave count since my call that the 2789 to 2762 area would hold on the last pull-back. The IWM chart shows a new perfect 50% Fib retracement, typical of major [2] wave. This first minor wave up is minor 1 of major [3]. Using the 3042 to 3113 target areas for minor 1, the minor 2 wave 50% Fibs are is 2940 to 2904. Note: The Major [3]=1.62*[1] target is at 4003.
SP-500 15-min chart:
SP-500 60-min chart:
SP-500 4-hr chart:
SP-500 daily chart:
Sorry, the comment form is closed at this time.


You must be logged in to post a comment.