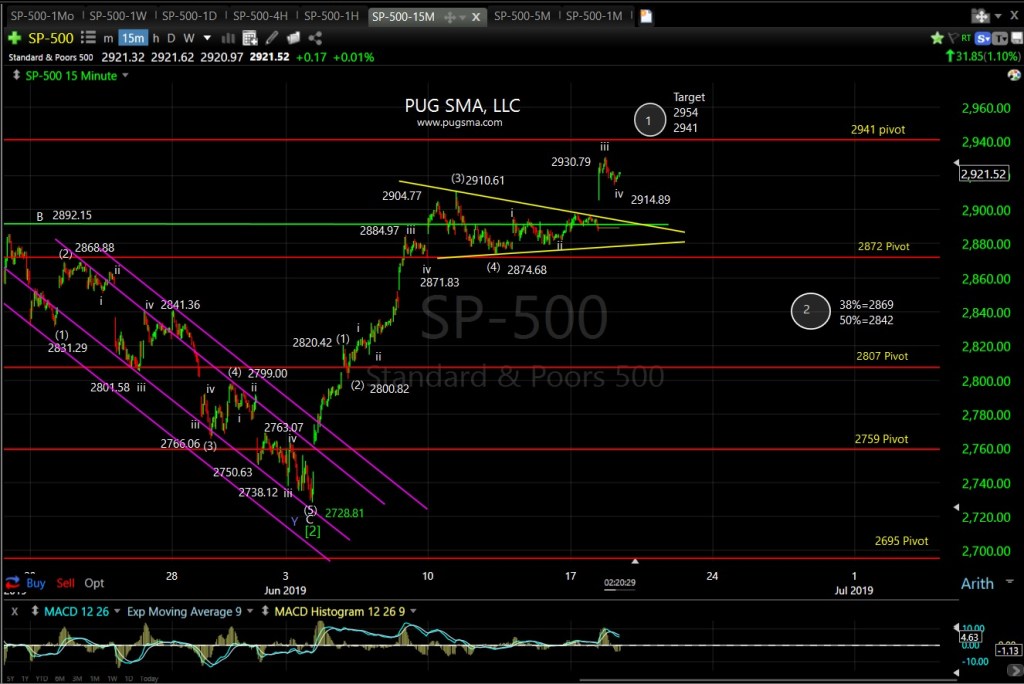
June 18th, 2019: SP-500 Chart Update
Posted by pugsma on June 18, 2019
2:30 pm EST: As expected the movement out of the tringle consolidation is in the direction of the move into the triangle (up). Looking for minor 1 of major [3]-P5-C1 to complete between 2931 (the minimum triangle target) and 2954 (old all-time high). But keep in mind that the SP-500 is in a major [3] bull wave and most surprises during a major [3] bull wave are upward (i.e. pull-backs are muted and are a typically bought aggressively).
SP-500 15-min chart:
SP-500 60-min chart:
SP-500 4-hr chart:
Sorry, the comment form is closed at this time.


You must be logged in to post a comment.