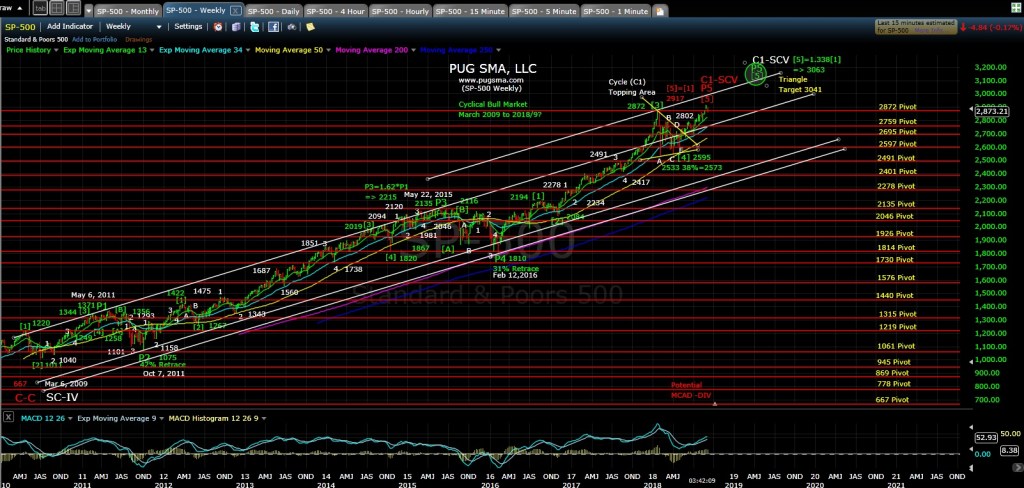
September 7th, 2018: SP-500 Chart Update
Posted by pugsma on September 7, 2018
3:55 pm EST: The SP-500 primary (blue) wave count is looking higher towards 3041 (3211 possible) for the top of P5-C1 into early to mid-year 2019. Wave ii-(3) of minor 3 of major [5]-P5-C1 is underway with a 50%/62% Fibonacci retrace target of 2860/2846. From there wave iii-(3) of minor 3 should move much higher toward a minor 3 = 1.62*minor 1 target at 3010.
The bearish alternate (red) wave count P5-C1 top at 2917 requires a break below 2802 and then 2791 begin confirmation.
Have a great weekend !!!
SP-500 15-min chart real-time link: http://www.freestockcharts.com?emailChartID=6b28cb91-88ed-4053-a003-7e7b4fb42ea2
SP-500 15-min chart:
SP-500 60-min chart:
SP-500 4-hr chart:
SP-500 daily chart:
SP-500 Weekly Chart:
Sorry, the comment form is closed at this time.


You must be logged in to post a comment.